Q1 2025 Market Report
Market Statistics and Analysis
The graph below shows the average Months of Inventory (MOI) in Los Angeles County since January 2024.
A 5.8% decrease in MOI between February & March indicates that the pace of home sales has started to pick up, likely a reflection of the spring market gaining momentum. Homes are selling quicker relative to the number of listings, which is good news for sellers aiming to list before peak competition in late spring and summer.
However, a significant 58.6% year-over-year jump in inventory shows that even though activity is improving month-to-month, overall inventory levels are much higher than they were a year ago relative to sales volume. This suggests that homes are generally sitting on the market longer, or that new listings are outpacing closed sales.
Going into the 2025 spring market, buyers may find more options and negotiating room than they had previously. Sellers on the other hand should focus on strategic pricing and presentation to help capture attention in a more balanced market.
Key Takeaways:
• Month-to-month, homes are beginning to sell faster, indicating the start to the spring selling season
• Year-over-year, homes have been staying on the market longer
• Buyers may find more options and negotiating room this spring compared to last year
• Pricing your property competitively and presenting it well is essential for capturing attention in a more balanced market
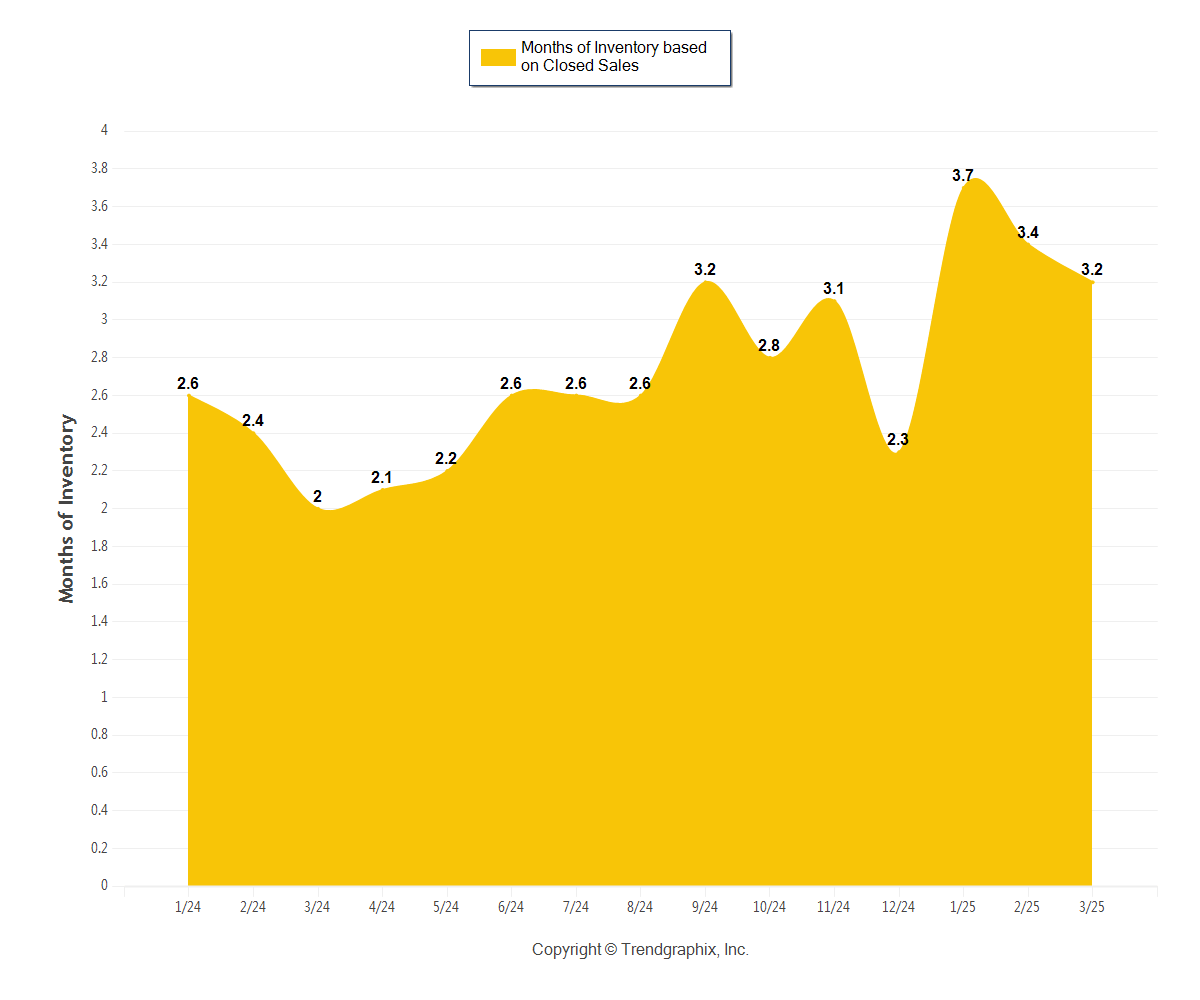
March 2025 was a Neutral market*
Months of Inventory based on Closed Sales in March 2025: 3.2
| • | Down 5.8% compared to last month |
| • | Up 58.6% compared to last year |
*Buyer's market: more than 6 months of inventory based on closed sales
 Seller's market: less than 3 months of inventory based on closed sales
 Neutral market: 3 - 6 months of inventory based on closed sales
Data for your neighborhood: