Annual Market Report 2024
(click on arrows to navigate through flipbook)
Market Statistics and Analysis
The graph below shows the average Months of Inventory (MOI) in Los Angeles County since October 2023.
A significant month-over-month drop between November & December is a reflection of the seasonal surge in closings we typically see during December. We also tend to get fewer new listings towards the end of the year as sellers wait for the more active spring market, contributing to a reduced supply.
This lowered inventory, coupled with the increased home demand due to the recent wildfires, will lead to a lot more urgency from buyers over the next few weeks and months. My advice for all prospective buyers is to act quickly and decisively on any homes you are interested in, and to work with an agent who is experienced negotiating within the area you are searching.
For sellers and owners, this is a great time to consider listing your property for sale or second-home for lease while demand is high. Just keep in mind, pricing your home competitively and presenting it well is still essential for ensuring a quick and successful transaction.
Key Takeaways:
• The drop in inventory between November and December reflects the typical year-end surge in closings and fewer new listings, as many sellers hold off until the spring market
• Buyers should act quickly & decisively on homes they are interested in
• Working with an experienced local agent is key to securing a home in this competitive environment
• Pricing your property competitively and presenting it well is essential for a successful transaction
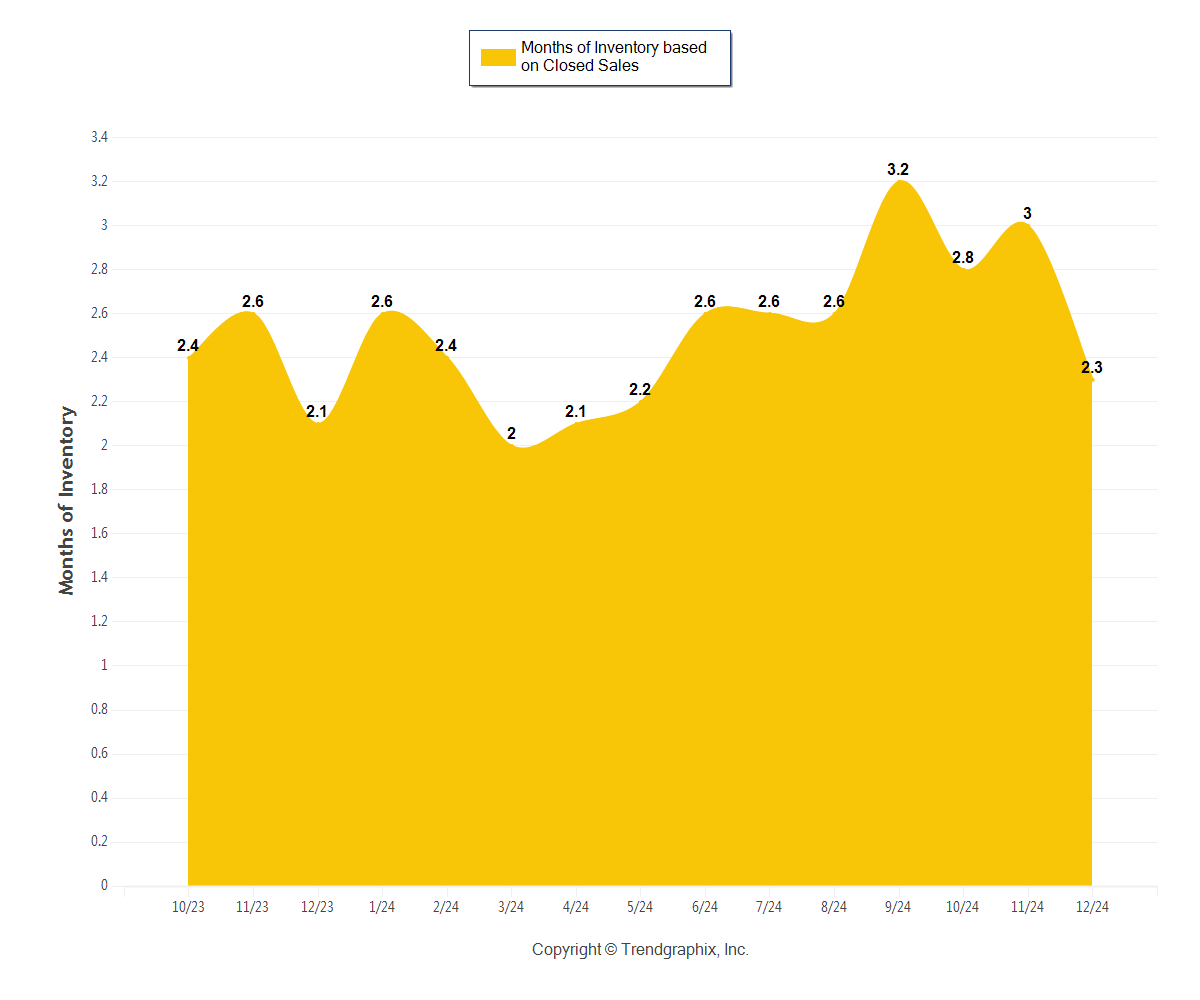
December 2024 was a Seller's market*
Months of Inventory based on Closed Sales in December 2024: 2.3
| • | Down 23% compared to last month |
| • | Up 9.8% compared to last year |
*Buyer's market: more than 6 months of inventory based on closed sales
 Seller's market: less than 3 months of inventory based on closed sales
 Neutral market: 3 - 6 months of inventory based on closed sales
Data for your neighborhood: