Manhattan Beach Real Estate Market: More Homes Are Selling Above Asking This Fall
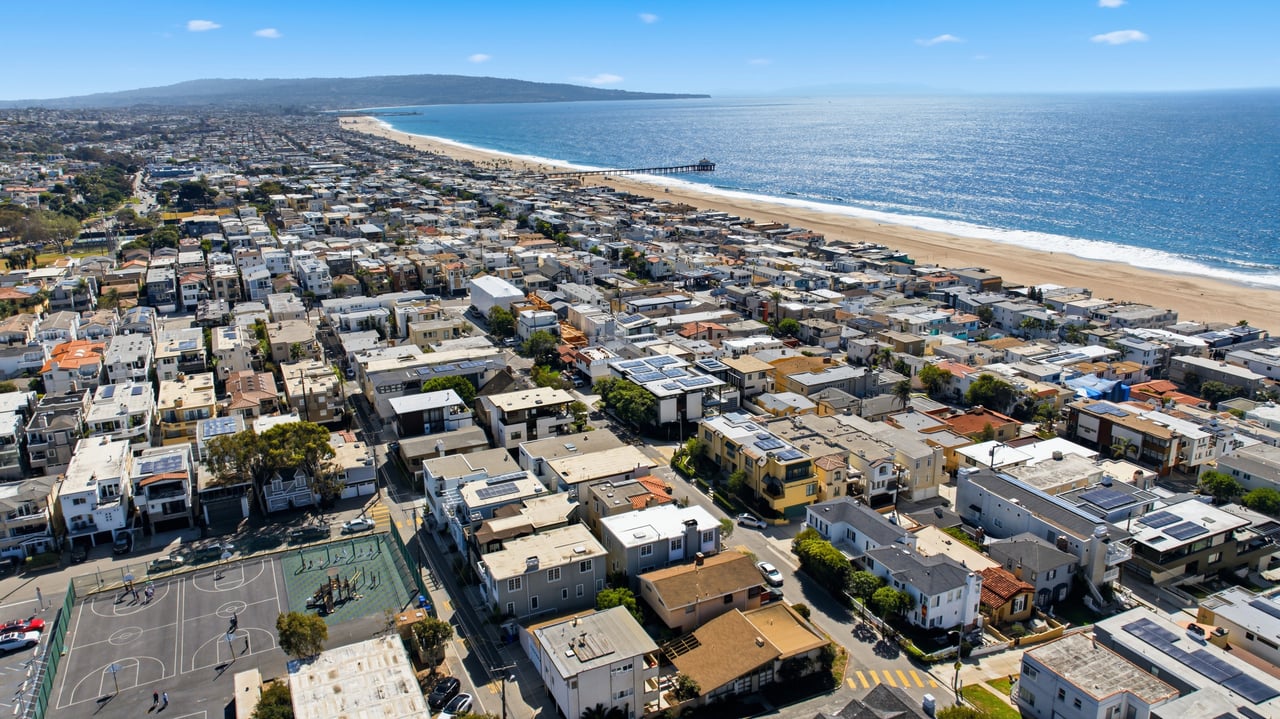
The Manhattan Beach real estate market is showing a notable shift this fall. More single-family homes are closing above their original asking prices than below them, and homes are selling in considerably less time than they did during the same period last year.
According to the latest CRMLS data, 41% of the 73 single-family homes sold in Manhattan Beach between August 21 and November 18, 2026, closed above their original asking price. In comparison, 38% sold below asking.
The numbers point to a change from the previous two falls, when below-asking sales were more common. They also place Manhattan Beach in a different position from the wider South Bay market, where below-asking sales continue to account for a larger share of transactions.
Here's a closer look at what the latest figures reveal.
1. More Manhattan Beach Homes Are Selling Above Asking Price
One of the most notable findings is the change in the percentage of homes closing above their original asking prices.
During the latest reporting period, 41% of Manhattan Beach single-family home sales closed above original asking, compared with 38% that closed below it. These figures are based on 73 closed sales over the 90-day period.
The difference becomes more apparent when compared with the previous two falls:
Reporting period | Sales above original asking price |
|---|---|
Two falls ago | 17% |
Last fall | 24% |
This fall | 41% |
In each of the two previous falls, 71% of single-family homes sold below asking. This fall, the share of homes selling below their original asking price was 38%.
The 41% figure does not mean that a majority of all homes sold above asking. It does show that above-asking sales have become more common relative to below-asking sales in the latest reporting period.
2. Homes Are Spending Less Time on the Market
Pricing is not the only area showing a change. Manhattan Beach homes are also selling faster.
The median time on market for a single-family home was 9 days, compared with 29 days during the same weeks last year.
Additionally, the median sale closed at 100% of its original asking price.
Together, these figures offer a useful view of the pace of the Manhattan Beach housing market this fall. Homes are spending fewer days on the market, and the median sale price is matching the property's original asking price.
3. How Manhattan Beach Compares With the Wider South Bay Market
Manhattan Beach's recent sales activity stands out against the broader South Bay figures.
Across all nine South Bay markets, 56% of single-family homes sold below their original asking prices during the reporting period.
In Manhattan Beach, by comparison, 38% of single-family homes sold below asking, while 41% closed above it.
This contrast shows why looking at individual city-level market activity can provide additional context beyond regional statistics. Conditions across the South Bay are not necessarily reflected in the same way in every local market.
4. How Many Single-Family Homes Are for Sale in Manhattan Beach?
Despite the faster pace of recent sales, buyers still have homes to consider.
As of November 18, 2026, there were 54 single-family homes listed for sale in Manhattan Beach.
This inventory figure provides a snapshot of the available listings on that date. It is worth considering alongside recent closed sales, as the number of homes currently available and the pace of completed transactions offer different perspectives on market conditions.
5. What These Numbers Could Mean for Buyers and Sellers
For buyers, the 9-day median time on market is a reminder that suitable, well-priced homes may require timely attention. Having financing, priorities, and an understanding of the local market in place can help buyers prepare to evaluate opportunities.
For sellers, the increased share of homes closing above original asking price is encouraging market context. However, the figures do not mean every property will receive offers above asking. A home's location, condition, presentation, pricing, and competition all contribute to its individual result.
Whether buying or selling, local data is most useful when considered alongside the details of a specific property and the circumstances of the transaction.
Final Thoughts: Understanding the Manhattan Beach Market
This fall's Manhattan Beach real estate activity reflects a shift in how single-family homes are selling. With 41% closing above original asking price, a median of just 9 days on market, and a median sale at 100% of original asking, the latest figures tell a different story from the previous two falls.
The wider South Bay market provides another useful point of comparison, but local conditions matter. Understanding the numbers at the city and property level can help buyers and sellers approach their next move with better context.
For insight into the Manhattan Beach market or guidance on buying or selling in the South Bay, connect with Rachel Ezra.
Data Source and Reporting Notes
Source: CRMLS. Single-family home sales: August 21–November 18, 2026. Active listings: As of November 18, 2026. Market comparisons use original asking prices. The median days-on-market comparison is against the same weeks last year. All figures reflect the reporting periods and property type stated above.