February 2025 Market Report
(click on arrows to navigate through flipbook)
Market Statistics and Analysis
The chart below shows the monthly average price of "for sale" and "sold" properties in Los Angeles County since November 2023. A 5% increase in year-over-year appreciation highlights long-term demand throughout Los Angeles County, despite higher interest rates and a seasonal dip in buyer activity. Sellers are pricing properties more competitively compared to this time last year, which could help facilitate quicker sales in a more balanced market.
However, an 11.4% increase in the average sold price indicates buyers are still willing to pay more for well-presented, high demand properties. For sellers, this means competitive pricing and presentation of your home remains crucial. For buyers, being prepared to act quickly is essential since attractive properties are still selling at a premium.
Key Takeaways:
• The overall market remains resilient with strategic opportunities for buyers and sellers alike
• For sellers, proper pricing and presentation when listing your property for sale remain crucial
• For buyers, being prepared to act quickly is essential since attractive properties are still selling at a premium
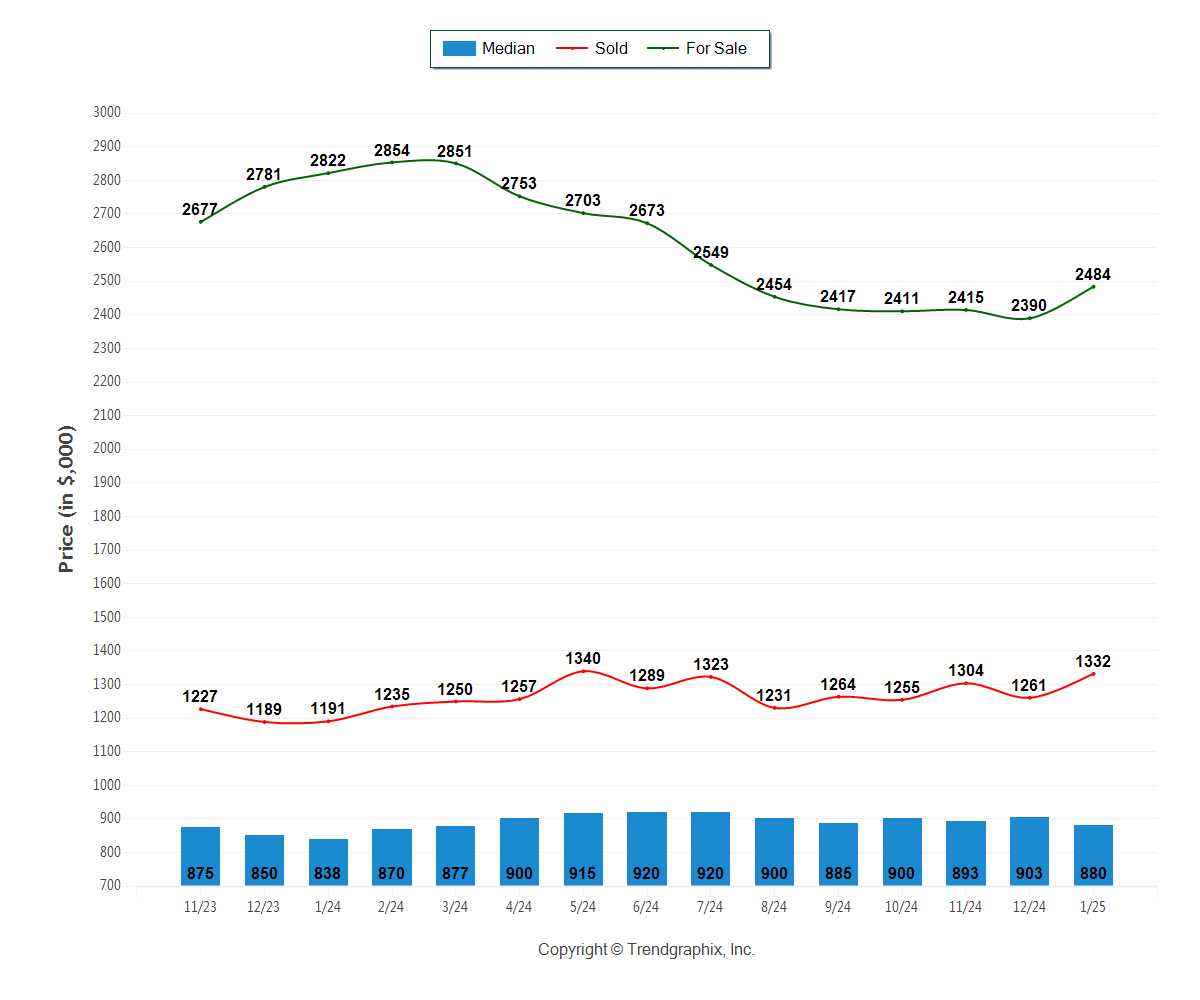
January 2025 Median Sold Price was Depreciating*
Average Median Sold Price in January 2025: $880
| • | Down 2.5% compared to last month |
| • | Up 5% compared to last year |
January 2025 Average For Sale Price was Appreciating*
Average For Sale Price (in thousand) in January 2025: $2484
| • | Up 3.9% compared to last month |
| • | Down 12% compared to last year |
January 2025 Average Sold Price was Appreciating*
Average Sold Price (in thousand) in January 2025: $1332
| • | Up 5.6% compared to last month |
| • | Up 11.8% compared to last year |
*Based on 6 month trend - Appreciating/Depreciating/Neutral
Data for your neighborhood: