September 2025 Market Report
(click on the arrows to navigate flipbook)
The graph below shows the average Months of Inventory (MOI) in Los Angeles County since July 2024. Month-to-month, inventory has decreased by 7.9%, signaling a slight tightening in market conditions. This suggests that homes are selling more quickly or fewer new listings have entered the market, creating a bit more competition among active buyers.
Compared to this time last year, inventory is up by 9.4%, reflecting a market that remains more balanced overall. While there are still more options available than a year ago, recent trends point toward a steadying pace and continued buyer activity.
For sellers, properties that are priced strategically and presented well continue to draw attention, even as competition increases. Buyers, meanwhile, benefit from a broader selection of homes than last year but may face renewed urgency as inventory begins to tighten again.
Key Takeaways:
• Month-over-month, inventory decreased by 7.9% suggesting slightly stronger demand or slower new listing activity
• Year-over-year, inventory increased by 9.4% pointing to a more balanced overall market
• Buyers have more choices than this time last year but may feel pressure from tightening supply
• Sellers who price and present their homes well continue to attract strong interest despite shifting market dynamics
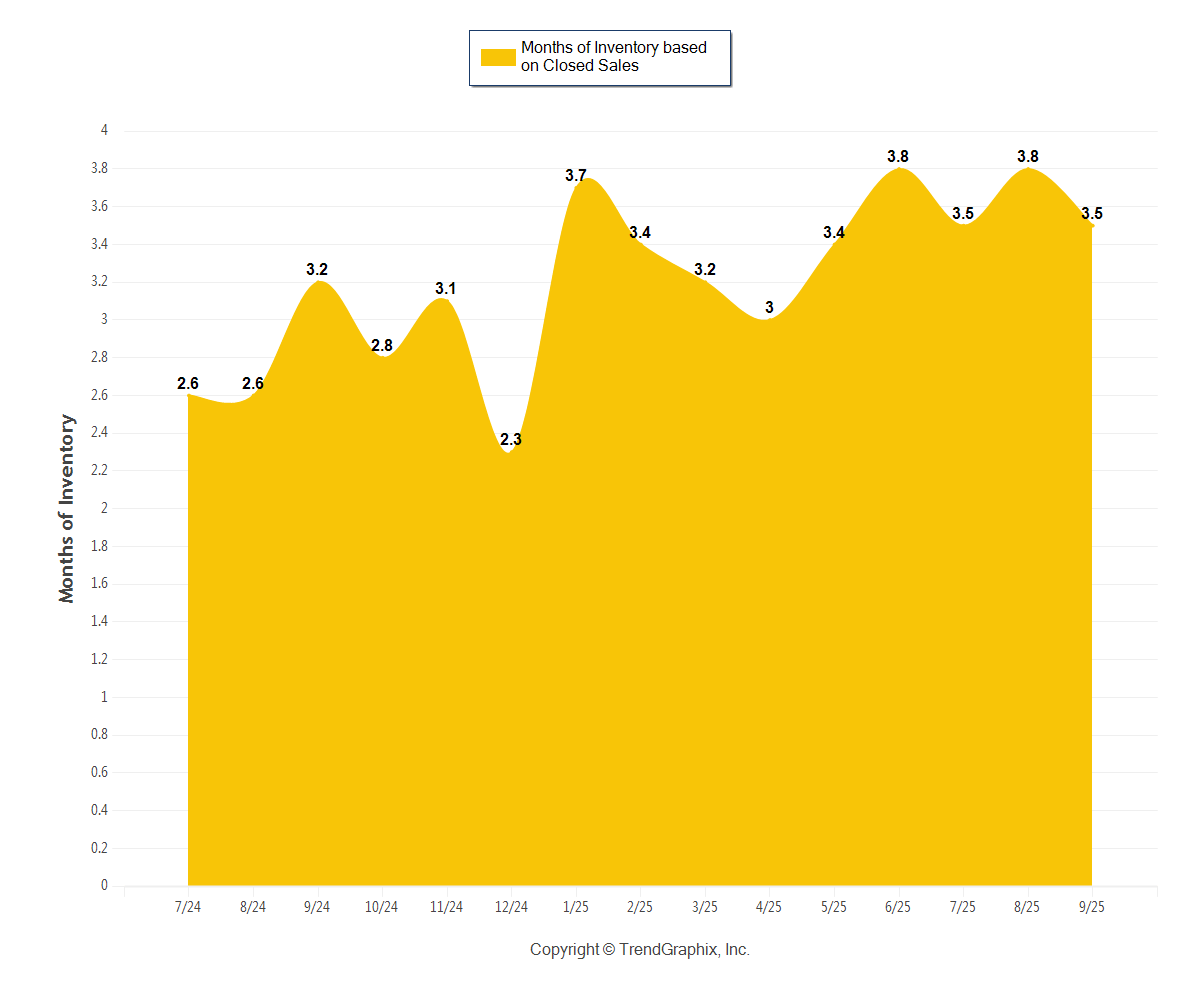
September 2025 was a Neutral market*
Months of Inventory based on Closed Sales in September 2025: 3.5
| • | Down 7.9% compared to last month |
| • | Up 9.4% compared to last year |
*Buyer's market: more than 6 months of inventory based on closed sales
 Seller's market: less than 3 months of inventory based on closed sales
 Neutral market: 3 - 6 months of inventory based on closed sales
Data for your neighborhood: