May 2025 Market Report
Market Statistics and Analysis
The chart below shows the “Average Days on Market” and “Sold/List Price Percentage” in the County of Los Angeles since March 2024. Month-over-month, the average days on market decreased by 5.9%, signaling a seasonal uptick in market activity as we move further into the summer months. On average, properties continue to sell at or near their original list price, highlighting steady pricing expectations among buyers and underscoring the importance of accurate pricing for sellers entering the market.
However, a noticeable 14.3% increase year-to-year points to a slower market overall. This trend reflects higher inventory levels and a buyer pool that is either being more deliberate or cautious in today’s economic environment. Still, despite the increased time on market, sale-to-list price ratios have remained steady, indicating that while it may take longer to secure the right buyer, sellers are still successfully achieving their target prices.
Key Takeaways:
• Month-to-month, home sales have increased by 5.9% signaling a seasonal uptick in market activity
• Compared to this same time last year, the average days on market has increased by 14.3% indicating a slower-moving market overall
• Homes have been selling at or close to list price suggesting a more balanced market
• Accurate pricing is key for sellers
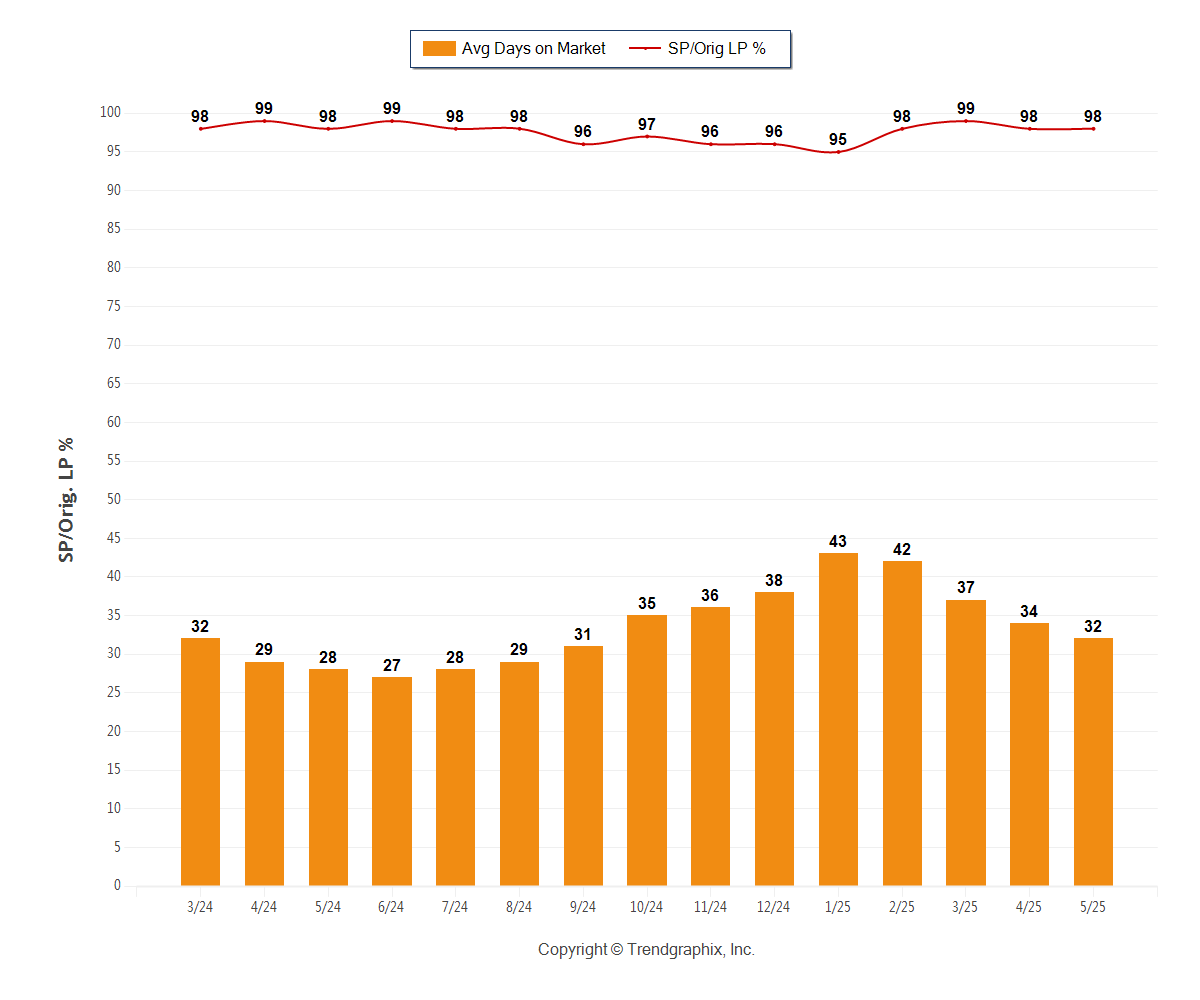
May 2025 Average Days on Market trend was Falling*
Average Days on Market in May 2025: 32
| • | Down 5.9% compared to last month |
| • | Up 14.3% compared to last year |
May 2025 Sold/Original List Price Ratio Remains Steady*
Sold/Original List Price % in May 2025: 98%
| • | 0% compared to last month |
| • | 0% compared to last year |
*Based on 6 month trend - Rising/Falling/Remains Steady*Buyer's market: more than 6 months of inventory based on closed sale
Data for your neighborhood: