November 2025 Market Report
The chart below shows the “Average Days on Market” and “Sold/List Price Percentage” in the County of Los Angeles since September 2024. Month-over-month, the average days on market rose by 2.4%, indicating a modest holiday season slowdown as homes take slightly longer to find the right buyer. While not a dramatic shift, it does suggest that buyers are taking a bit more time to evaluate their options.
Looking at the annual trend, the change is more pronounced. Compared to this time last year, the average days on market has increased by 19.4%, showing that homes are spending noticeably longer on the market than they were in late 2024. Meanwhile, the sold-to-original list price ratio has held steady both month-over-month and year-over-year, registering no measurable change. This stability suggests that even though buyers are moving at a slower, more deliberate pace, sellers are still generally achieving their initial pricing expectations. Overall, the market reflects a more patient buyer pool, steady pricing discipline, and conditions that reward well-priced, well-prepared listings.
Key Takeaways:
• Month-to-month, homes are taking slightly longer to sell
• Compared to last year, homes are spending nearly 20% longer on the market
• Sale-to-list ratios remain unchanged, indicating stable pricing despite slower pace
• Sellers can still succeed, but accurate pricing and strong presentation remain essential
Los Angeles County
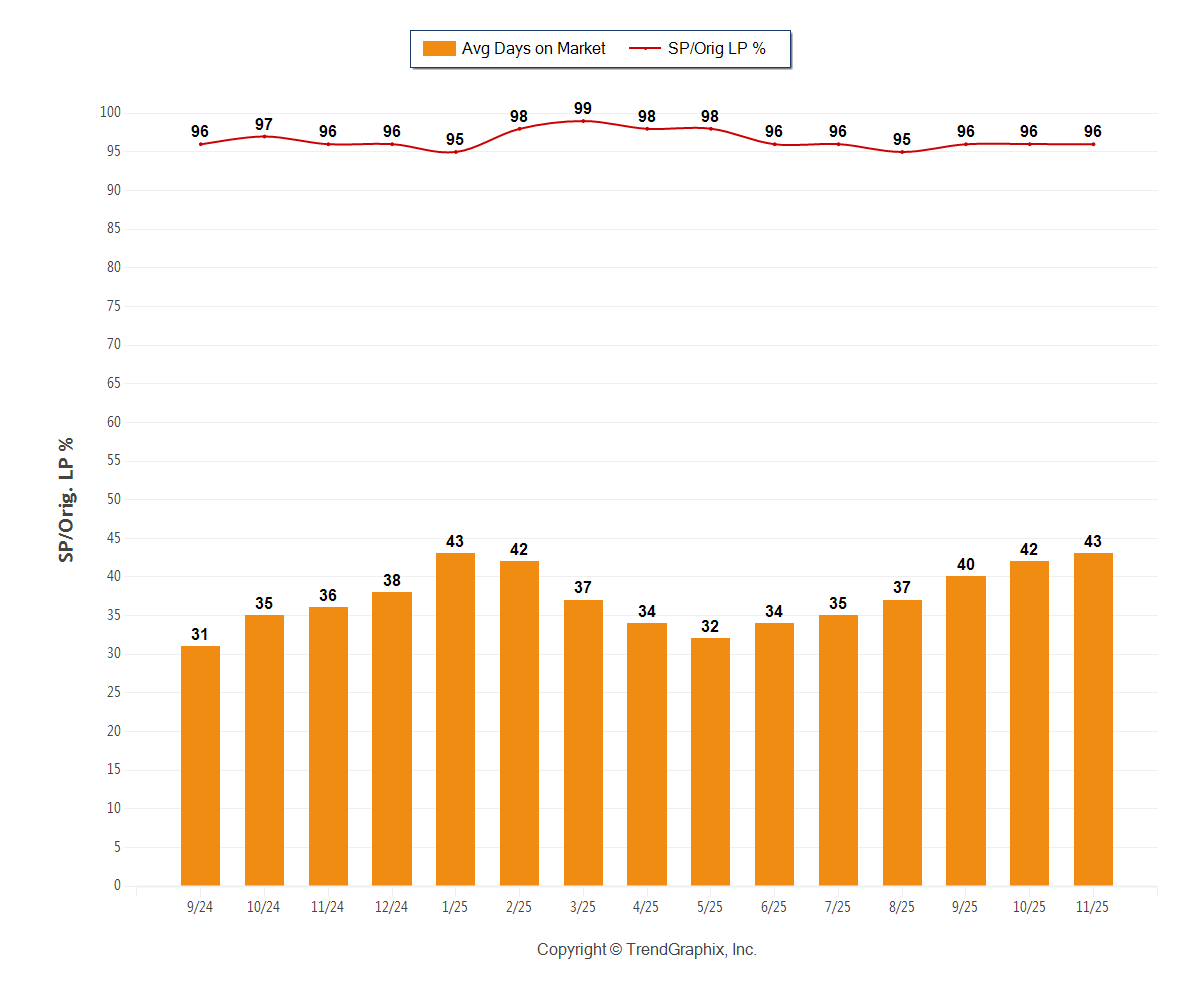
November 2025 Average Days on Market trend was Rising*
Average Days on Market in November 2025: 43
November 2025 Sold/Original List Price Ratio Remains Steady*
Sold/Original List Price % in November 2025: 96%
Average Days on Market in November 2025: 43
| • | Up 2.4% compared to last month |
| • | Up 19.4% compared to last year |
November 2025 Sold/Original List Price Ratio Remains Steady*
Sold/Original List Price % in November 2025: 96%
| • | 0% compared to last month |
| • | 0% compared to last year |
*Based on 6 month trend - Rising/Falling/Remains Steady