May 2024 Market Report
(click on arrows to navigate through flipbook)
Market Statistics and Analysis
The chart below shows the monthly average price of "for sale" and "sold" properties in Los Angeles County since February 2023. As you can see, the “for sale” price was neutral, and the average “sold” price is increasing. Since April of last year, Los Angeles County has remained a Seller's Market.
Most analysts see mortgage rates hovering at elevated levels of between 6.5% and low-7% through the rest of the year. With inflation picking up again, the Fed is holding off on rate cuts, which can reignite an escalation in prices. Take a moment to click on the name of your city under the chart below to look at the specific statistics in your area.
Key Takeaways:
- Homes are selling at a higher price
- Mortgage rates are staying high
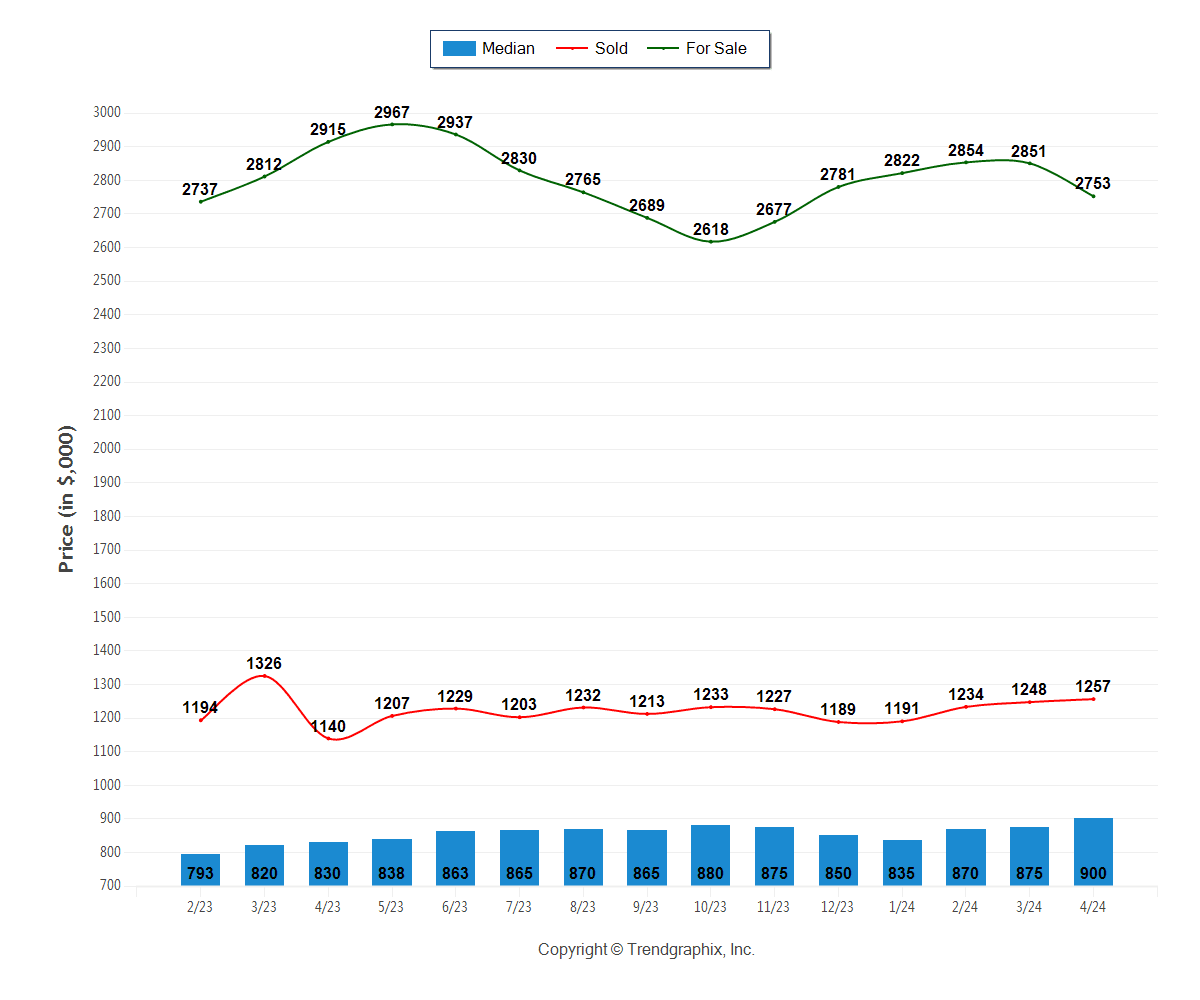
April 2024 Median Sold Price was Appreciating*
Average Median Sold Price in April 2024: $900
| • | Up 2.9% compared to last month |
| • | Up 8.4% compared to last year |
April 2024 Average For Sale Price was Neutral*
Average For Sale Price (in thousand) in April 2024: $2753
| • | Down 3.4% compared to last month |
| • | Down 5.6% compared to last year |
April 2024 Average Sold Price was Appreciating*
Average Sold Price (in thousand) in April 2024: $1257
| • | Up 0.7% compared to last month |
| • | Up 10.3% compared to last year |
*Based on 6 month trend - Appreciating/Depreciating/Neutral
Data for your neighborhood: